Definition of Quality
Quality is a somewhat abstract, subjective concept with people interpreting it differently. Like the 'theory of relativity', quality is expressed as a relative concept and can be different things to different people. For example:
"A Rolls Royce car is a quality car for certain customers whereas a VW Beatle can be quality car for other customers."
Therefore, consumers may tend to focus on the eventual specification quality of a product/service, or how it compares with the competing companies in the marketplace. However, producers might measure the conformance quality, or the degree to which the product/service was produced correctly. The producer of a product may focus on process variation minimisation, to achieve uniformity amongst and between batches.
Five discrete and interrelated definitions of quality are listed below (Garvin, 1988):
- Transcendent (excellence)
- Product-based (amount of desireable attribute)
- User-based (fitness for use)
- Manufacturing-based (conformance to specification)
- Value-based (satisfaction relative to price)
Six Sigma
Six sigma represents a set of techniques and tools for implementing process improvement. This improvement is achieved through identifying and subsequently removing the causes of defects, thus minimising variability in manufacturing and business processes. A six sigma process is one in which 99.99966% of all opportunities to produce some feature or part are statistically expected to be free of defects (3.4 defective features per million opportunities). A defect in this sense can be defined as any variation of a required characteristic of the product for its parts, which is far enough removed from its nominal value to prevent the product from fulfilling the physical and functional requirements of the customer.
Normal distribution curves (Figure 1) are symmetrical about the mean value (μ), with the total area under the curve equating to one. If a process is classified as 3 sigma, 99.7% of outputs are defect free. Mean is the central tendency of the process, or the average of all values within the population. The standard deviation (σ) is a measure of dispersion or variability.
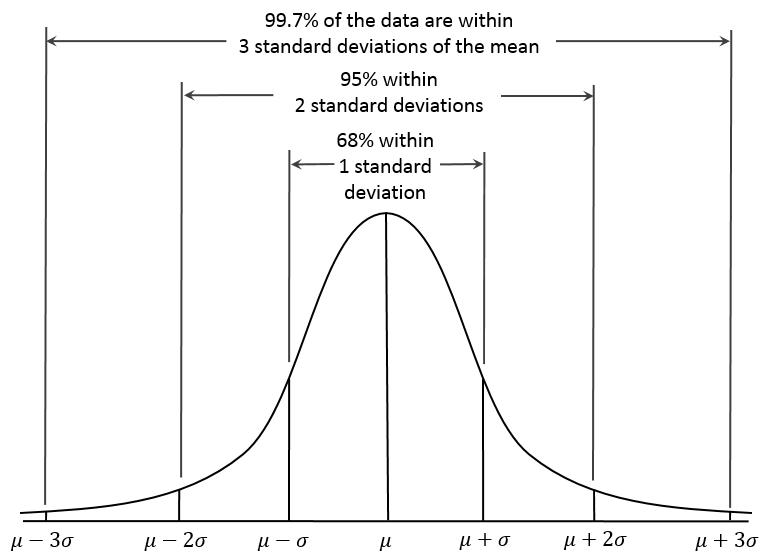
The upper specification limit (USL) and the lower specification limit (LSL) set permissible limits for the process variation. For example, the USL and LSL of a process may be set at 3σ and -3σ, thus yielding a process which is 99.7% defect free. USL represents a value designating an upper limit above which the process or characteristic performance is unacceptable. In the converse case, the LSL represents a value designating a lower limit, below which the process or characteristic performance is unacceptable.
The relationship between yield, variability and specification limits is that essentially the specification limits provide the permissible process variations. Minimising variability therefore inherently leads to a better yield, as the probability of defects occurring is substantially mitigated. Cp and Cpk represent metrics of process quality. Cp is a measure of how capable the process is of producing the required process characteristic. Cp is known as the capability index, or design margin, and is calculated using the following equation:

Cpk is a measure of actual performance which takes the operating mean into account. Cpk is equal to Cp when the process mean is equal to the target, or nominal value. Cpk accounts for the process mean not hitting the target value. The following calculations can be used to determine Cpk.


Poisson distributions describes the probability distribution of an event occurring with respect to time, or space. The eventual process yield can be calculated using Poisson's formula as presented below, where dpu is the measured defects per unit.

As an example, if average dpu = 1, the probability of having a device with no defects can be calculated as:

Relationship Between Quality and Reliability
Quality assures the product will work after assembly, whereas reliability relates to the probability that the design will perform its intended function for a designated period of time under specified conditions. Engineering process reliability is the fundamental concept that is meant to anticipate quality failures over the life cycle of a product. Variation of the process output may affect both quality and reliability.
Controlling reliability is much more complex and cannot be controlled by a standard "quality" (Six Sigma) approach, as they need a systems engineering approach. Quality is a snapshot at the start of life and mainly related to control of lower level product specifications and reliability is (as part of systems engineering) more of a system level motion picture of the day-by-day operation for many years. Time zero defects are manufacturing mistakes that escaped quality control, whereas the additional effects that appear over time are 'reliability defects'.
Impact of Quality on Cycle Time and Cost
These three project managment constraints are traditionally represented in what is known as the "Iron Triangle", depicted in Figure 2.
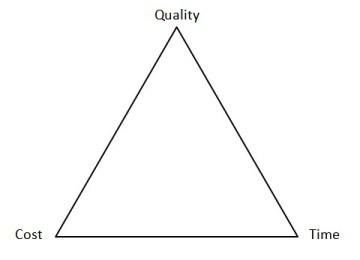
The relationship between the three constraints means that management staff end up having to make a choice between two out of the three of them; in other words, "Pick any two". Accordingly, one of the following is likely to occur:
- Designing a product to a high standard with a low time to market, at the cost of being expensive
- Designing a product quickly and at a low cost, at the expense of the product quality
- Designing a product to a high standard and at a low cost, but taking a long time to market.
ISO 9000
The ISO 9000 is family of standards that gives requirements for an organization's quality management system (QMS). It can be adopted to help ensure organisations meet the standards of customers and stakeholders whilst meeting the statutory and regulatory requirements of products. ISO 9000 is based on the following eight quality management principles:
- Customer focus
- Leadership
- Involvement of people
- Process approach
- System approach to management
- Continual improvement
- Factual approach to decision making
- Mutually beneficial supplier relationships
Global adoption of the ISO 9000 standard is growing annually - the number of global ISO certified organisations recorded in the world by the end of 2014 was 1,138,155, up from 409,421 by the end of 2000. The reason for the global adoption can be attributed to a number of the following:
- Creates a more efficient, effective operation
- Increases customer satisfaction and retention
- Reduces audits
- Enhances marketing
- Improves employee motivation, awareness, and morale
- Promotes international trade
- Increases profit
- Reduces waste and increases productivity
- Common tool for standardization http://www.emeraldinsight.com/doi/pdfplus/10.1108/17542730910995846 A range of Case Studies can be viewed to support the claims made.
Check Sheets
A Check Sheet is a form used to collect data in real time at the location where the data is generated. A simple example of a Check Sheet can be seen in Figure 3.
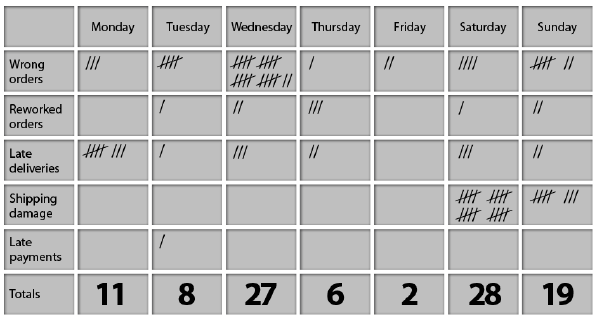
The pertinent advantages of utilising Check Sheets for gathering data are as follows:
- They are a quick, very easy and efficient means for recording desired information.
- Information gathered can be either qualitative or quantitative.
Check Sheets can generally be used to:
- Quantify defects by type, location, and cause (e.g. from a machine or worker).
- Keep track of the completion of steps in a multi-step procedure (i.e. be used as a checklist).
- Check the shape of the probability distribution of a process.
Pareto
The Pareto principle (also known as the 80 - 20 rule, the law of the vital few, and the principle of factor sparsity) states that, for many events, roughly 80% of the effects come from 20% of the causes. The term 80 - 20 is only a shorthand for the general principle at work. In individual cases, the distribution could just as well be, say, 80 - 10 or 80 - 30. There is no need for the two numbers to add up to the number 100, as they are measures of different things. A simple example of a pareto chart is presented in Figure 4.
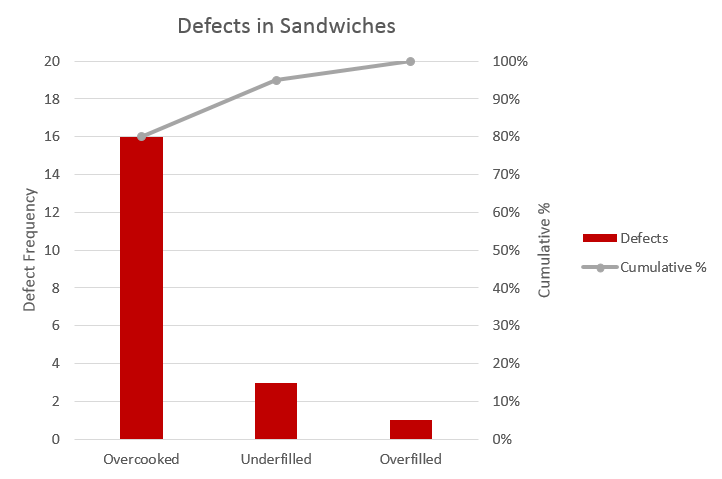
If the two values sum to 100, this leads to a nice symmetry. For example, if 80% of effects come from the top 20% of sources, then the remaining 20% of effects come from the lower 80% of sources. This is called the "joint ratio", and can be used to measure the degree of imbalance. For example, a joint ratio of 96:4 is very imbalanced, 80:20 is significantly imbalanced, 70:30 is moderately imbalanced (Gini index: 40%), and 55:45 is just slightly imbalanced.
This principle is particularly prominent in the field of Software Engineering, as highlighted by the following examples:
Microsoft noted that by fixing the top 20% of the most-reported bugs, 80% of the related errors and crashes in a given system would be eliminated.
In load testing, it is common practice to estimate that 80% of the traffic occurs during 20% of the time.
In Software Engineering, Lowell Arthur expressed a corollary principle: "20 percent of the code has 80 percent of the errors. Find them, fix them!"
Fishbone Ishikawa Diagrams
Ishikawa diagrams (also called fishbone diagrams) are causal diagrams that show the causes of a specific event. Common uses of the Ishikawa diagram are product design and quality defect prevention to identify potential factors causing an overall effect. Each cause or reason for imperfection is a source of variation. Causes are usually grouped into major categories to identify these sources of variation. The categories typically include:
- People: Anyone involved with the process
- Methods: How the process is performed and the specific requirements for doing it, such as policies, procedures, rules, regulations and laws
- Machines: Any equipment, computers, tools, etc. required to accomplish the job
- Materials: Raw materials, parts, pens, paper, etc. used to produce the final product
- Measurements: Data generated from the process that are used to evaluate its quality
- Environment: The conditions, such as location, time, temperature, and culture in which the process operates
A typical, simplistic example of an Ishikawa diagram is presented in Figure 5.
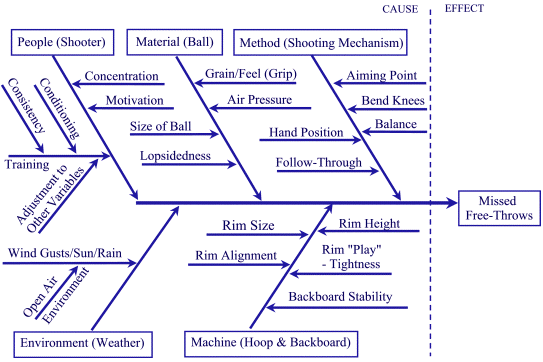
There have been identified topics for fishbone diagram cause classes in different areas of development. They are grouped into easily remembered sets, examples of which are presented below.
- The 5 M's (used in manufacturing industry):
- Machine (technology)
- Method (process)
- Material (Includes Raw Material, Consumables and Information)
- Man/mind Power (physical work)
- Measurement (Inspection)
- The 8 P's (primarily used in service marketing industry):
- Product/Service
- Price
- Place
- Promotion
- People/personnel
- Process
- Physical Evidence
- Publicity
- The 4 S's (used in service industry):
- Surroundings
- Suppliers
- Systems
- Skills
Cause Screening
Screening can be used to eliminate brainstorming and hypothesizing at the beginning of a project. The project team first makes non-invasive observations of the operation. They ignore everything in the middle, and only compare examples of the very best and very worst outputs, searching for consistent differences.
The guidelines are simple:
- Any factor that is consistently different when the best and worst outputs occur is deemed critical, and the team pursues it.
- Any factor that is not consistently different is deemed non-critical, and the team ignores it.
With this screening process, practitioners non-invasively observe and review data from the existing operation, and are usually able to separate the critical and non-critical factors more quickly than with the traditional trial-and-error approach.
Teamwork
Teamwork should encompass the following concepts:
- Knowledge
- Design
- Redesign
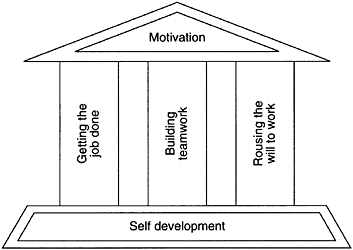
Teamwork is someting that requires training. Product owners should not delegate and control every aspect, as this can stifle teamwork and involvement. Constant improvement is the responsibility of managers. Most causes of low quality and productivity are due to issues at this level. An internal consultant can be hired to reslove teamwork issues.
Aspects related to Teamwork involve:
- Collaboration
- Communication, (intra or inter departmental)
- Involvement
- Training teamwork, along with tools and techniques of quality control, and philosophy of quality culture
A diagram depicting the core principles of Teamwork can be seen in Figure 6.
Multi-voting
Mutli-voting allows a group to narrow down a list of options into a manageable size for further consideration. It is useful for initiating a selection process after brainstorming. Multivoting is a group decision-making technique used to reduce a long list of items to a manageable number by means of a structured series of votes. The result is a short list identifying what is deemed important to the team.
Sometimes referred to as N/3 voting - for N options, each member of the group selects N/3 of the options as a means for partial-ordering the options by importance.
Multivoting Procedures:
- Step 1 - Work from a large list
- Step 2 - Assign letter to each item
- Step 3 - Vote
- Step 4 - Tally the votes
- Step 5 - Repeat
Multivoting Rule of Thumb:
| Size of Team | Eliminate items with |
|---|---|
| 5 or fewer | 0, 1, or 2 votes |
| 6 to 15 | 3 or fewer votes |
| more than 15 | 4 or fewer votes |
Statistical Process Control
Statistical process control (SPC) is a method of quality control which uses statistical methods. SPC is applied in order to monitor and control a process. Monitoring and controlling the process ensures that it operates at its full potential. In this case, the process can make as many conforming products as possible while minimising waste. SPC can be applied to any process where the "conforming product" (product meeting specifications) output can be measured. Key tools used in SPC include control charts; a focus on continuous improvement; and the design of experiments. An example of a process where SPC is applied is manufacturing lines. It uses a process of physical inspection to separate good products from bad.
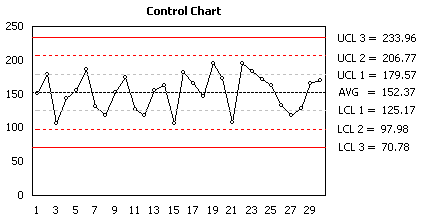
A key part of statistical process control is producing control charts (Figure 7) which can be used for visualising effects of eliminating process issues over time.
Objective analysis of variation
SPC must be practiced in 2 phases: The first phase is the initial establishment of the process, and the second phase is the regular production use of the process. In the second phase, a decision of the period to be examined must be made, depending upon the change in 4 - M conditions (Man, Machine, Material, Method) and wear rate of parts used in the manufacturing process (machine parts, jigs, and fixture).
Emphasis on early detection
An advantage of SPC over other methods of quality control, such as "inspection", is that it emphasizes early detection and prevention of problems, rather than the correction of problems after they have occurred.
Increasing rate of production
In addition to reducing waste, SPC can lead to a reduction in the time required to produce the product. SPC makes it less likely the finished product will need to be reworked upon completion.
Limitations
SPC is applied to reduce or eliminate process waste. This, in turn, eliminates the need for the process step of post-manufacture inspection. The success of SPC relies not only on the skill with which it is applied, but also on how suitable or amenable the process is to SPC. In some cases, it may be difficult to judge when the application of SPC is appropriate.
Taguchi
The Taguchi approach to Design of Experiments (DoE) necessitates the use of orthogonal arrays to implement fractional factorial experiments. Orthogonal in this sense essentially states that each control factor in the experiment is independent of each other and can thus be evaluated independently. The general approach to establishing Taguchi experiments is a three step process, as listed below:
- Identify the number of control factors required.
- Select the number of level settings for each control factor.
- Select an appropriate pre-defined Taguchi Array depending on the number of control factors and levels.
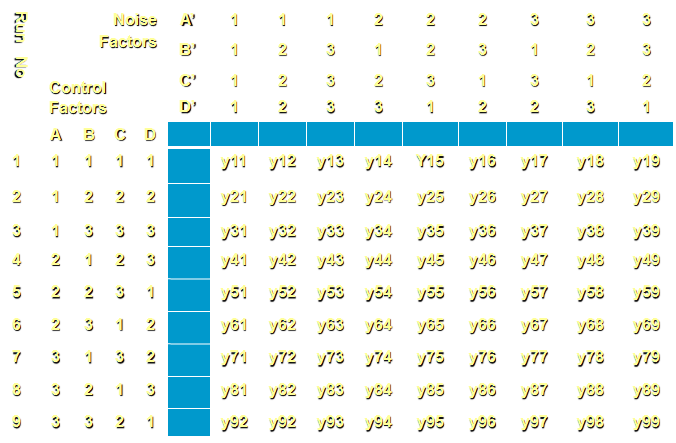
The three step process shall essentially define the number of experimental runs required. As an example, Figure 8 below represents a L9 orthogonal array which accounts for 4 control factors operating with 3 levels. It should be noted that there are an equal number of level 1, 2 and 3 settings across the nine experiments. In addition, there are an equal number of 1, 2 and 3 level settings for every other factor across all experimental runs.
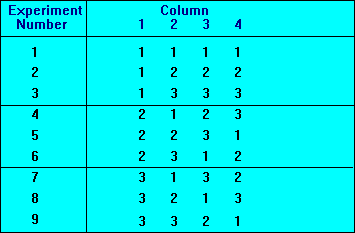
A more comprehensive list of available Taguchi Arrays can be consulted. The Taguchi process enables the addition of noise factors into the experiment. The noise is introduced into each run, with the resulting variation quanitfied as a comparable Signal to Noise Ratio (SNR). Control factor settings that minimise SNR are chosen to yield the most robust process possible. Noise added experiments are performed using duplicate Taguchi arrays to model the addition of the noise contol factors. An L9 Taguchi array with noise is presented in Figure 9 below.
The confirmation run is a crucial requirement when using Taguchi Arrays. Confirmation runs are needed in order to validate experimental success or identify problems with the experiment. These problems may potentially manifest themselves in the form of factors left out of the experiment, or interactions between the included control factors. The underlying advantages and limitations of Taguchi's approach to fractional factorial experiments are presented below.
Advantages:
- Orthogonal arrays reduce number of exprimental runs
- Simple calculations
- Enabled effect of control and noise factor variation to be optimised
Limitations:
- Does not deal well with interactions
- Not suited to multi-characteristic optimisation
- Large number of runs when using noise arrays
Design of Experiments
Design of Experiments (DoE) represents a systematic method to determine the relationship between factors and their interactions to assess how these are affecting the output of that process. It is essentially an approach to determining 'cause and effect' relationships. The DoE method is used to maximize the information obtained from experimental data through very few trials or runs. Four approaches to DoE are listed below:
- Full factorial
- Fractional factorial
- Taguchi Methods
- RSM (Response Surface Methodology)
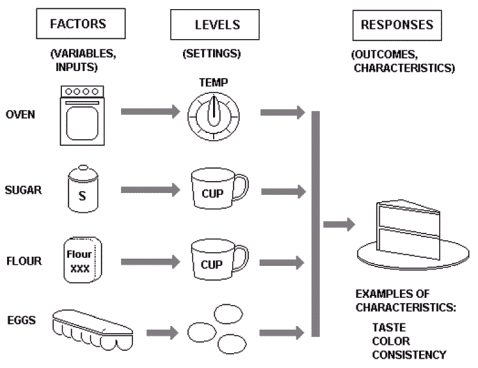
There are typically three components which comprise experimental design. These are detailed below. We take a simplistic example of a cake-baking process to contextualise the DoE approach:
- Factors represent the inputs to the process: These can be stipulated as either controllable or uncontrollable variables. In the cake-baking process example these would correspond to the oven and ingredients typically.
- Levels represent the settings of each factors. Typical examples of this in the cake-baking process would be the oven temperature and the ingredient amounts included.
- Responses represent the output of the experiment. In the simplistic case of baking a cake these responses could manifest themselves in the form of the taste, consistency and the appearance of the cake. These responses are ultimately affected by the level settings of each factor.
Figure 10 presents the typical DoE approach to baking a cake, highlighting the factors, levels and typical responses.
The rationale supporting the cake baking DoE approach is as follows:
- Comparing Alternatives - We may want to compare the results from two different types of flour, if it turned out that flour types produced similar results, we could purchase from the low cost supplier.
- Significant Control Factors - We may want to determine what the significant factors are.
- Optimal Process Output - Enables determination of the optimal set of factors and corresponding level to achieve the exact taste and consistency.
- Reducing Variability - Can the recipe be changed slightly without detriment to the responses.
- Improving Process Robustness - Improving the fitness for use under varying conditions. For example, can the factors and their levels (recipe) be modified such that cake will come out nearly the same, irrespective of what oven is used.
The pertinent benefits of the DoE approach are as follows:
- Quick, economical and efficient method to identify most significant input factors.
- Simultaneous trials with multiple control factors instead of one variable at a time.
- Gives interaction effects of control factors.
- Fewer simulations required to get process insight.
- Factor effects can be easily measured.
- Explore relationship of response and control factors.
- Cheaper than reducing fabrication or simulation bottlenecks.
Software Process Improvement Tools
A Software process is defined as the system of all tasks and the supporting tools, standards, methods, and practices involved in the production and evolution of a software product. TQM tools, such as Cause & Effect Diagrams, Pareto Charts and Check Sheets can all be used to improve software processes.
One approach that can be used to improve a business' software process is the PDCA cycle - Plan, Do, Check and Act (The role of Software Process Improvement into Total Quality Management: an Industrial Experience, 2000). This approach can be split up into the following four steps:
- Planning: involves the reviewing of data and information, establishing and documenting action plans and their deployment in their specific areas.
- Do: involves the execution of the plans.
- Check: involves performing reviews in their specific areas, integrating leadership and lower level departments.
- Act: involves implementing any system changes and the fulfillment of the goals, following the reviews.
References
- Total Quality Management: Text, Cases, and Readings, Third Edition; Joel E. Ross, Susan Perry, 1999
- Fundamentals of Total Quality Management; Jens J. Dahlgaard, Kai Kristensen, Gopal K. Kanji, 1998
- Total Quality Management as Competitive Advantage: A Review and Empirical Study; Thomas C. Powell, 1995
- Total quality management implementation frameworks: Comparison and review; Sha'Ri Mohd Yusof, Elaine Aspinwall, 2000
- Multivoting; University of Kentucky, Program and Staff Development, https://psd.ca.uky.edu/files/multivot.pdf
- Multi-Voting, goLeanSixSigma, https://goleansixsigma.com/multi-voting/
- Taguchi Slides, http://www.slideshare.net/MentariPagi4/tqm-taguchi
- Taguchi, Teicholz, http://ntrs.nasa.gov/archive/nasa/casi.ntrs.nasa.gov/20040121019.pdf
- TQM Software Tools, http://www.emeraldinsight.com/doi/pdfplus/10.1108/09544789610125333
- DoE barriers, http://www.emeraldinsight.com/doi/pdfplus/10.1108/17542730910995846
- ISO 9000 Case Studies, http://www.bsigroup.com/en-GB/iso-9001-quality-management/case-studies
- The role of software process improvement into total quality management: an industrial experience; R. L. Della Volpe, 2000